The Short Version
Most small practices want to know how things are actually running, how quickly messages get answered, whether tasks are getting done on time, how workload is distributed across the team, but pulling that picture together at the end of each month usually means manually checking several separate systems and compiling the numbers by hand. That manual reconstruction is exactly why monthly reporting so often turns into a scramble the day it's due, rather than a quick summary of information that was already visible all month.
Why This Is Harder Than It Should Be
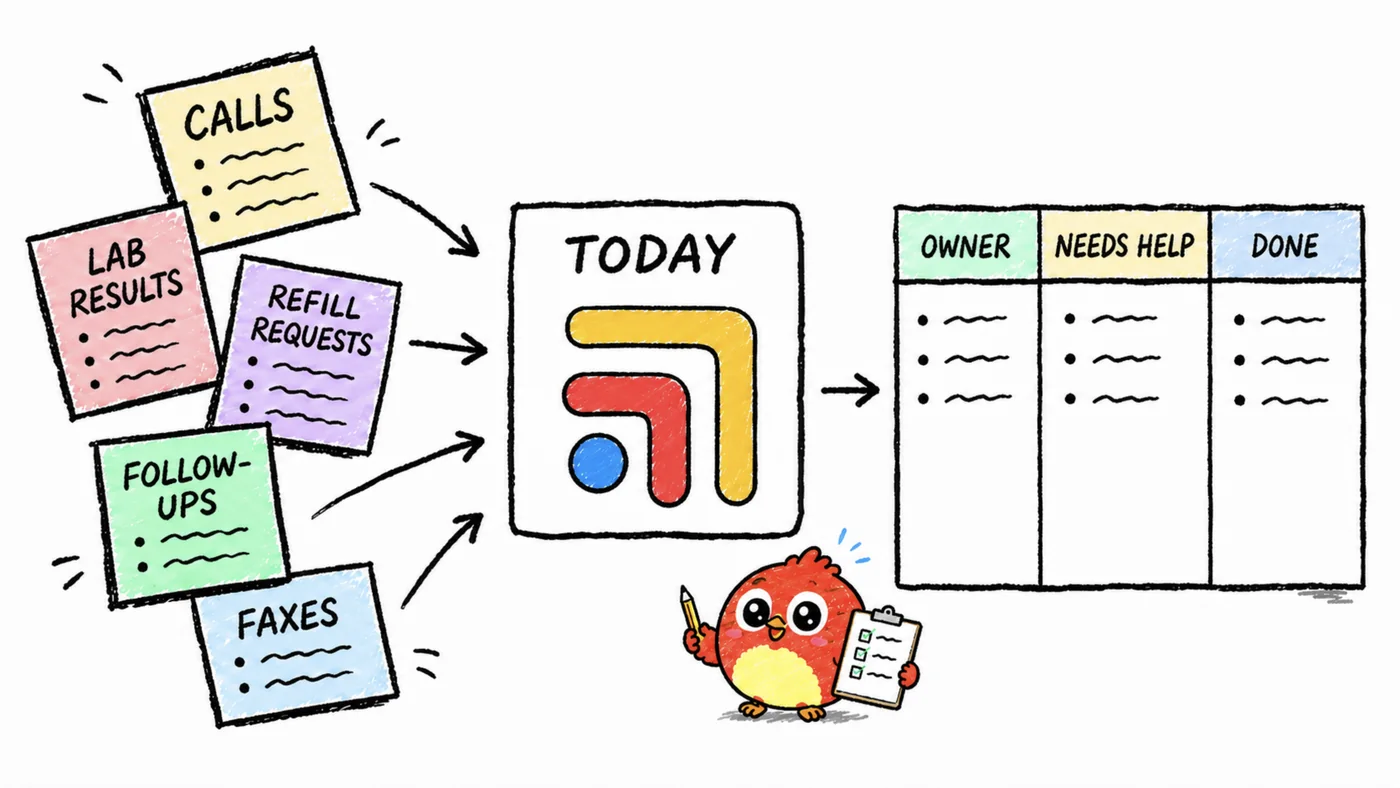
The data needed for a monthly ops rollup usually exists somewhere. Message response times might be visible in the messaging platform. Task completion might be trackable in the EHR or a separate to-do system. No-show rates live in the scheduling tool. The problem isn't that this information doesn't exist, it's that it exists in separate places, in different formats, with nothing pulling it together automatically.
Compiling it by hand each month is tedious and error-prone, which is exactly why it tends to get done at the last minute, right before a report is due, rather than incrementally throughout the month when it would be far less painful.
What Makes Monthly Rollups Specifically Frustrating
Unlike a lot of the workflows in this series, this isn't about catching something before it slips through the cracks. It's about the sheer manual effort of reconstruction. The information was captured, technically, somewhere. But "technically captured somewhere" and "readily available as a summary" are very different things, and the gap between them is what makes the last week of every month feel like a data-hunting exercise instead of a quick review.
What a Working Monthly Rollup Looks Like
A consistent set of metrics gets tracked, not reinvented each month. Deciding once what actually matters, task completion rate, average response time, workload distribution, whatever's relevant to your practice, and sticking with that same set makes month-over-month comparison possible and prevents the scope of the report from growing unpredictably each time.
The underlying data gets captured as work happens, not reconstructed afterward. If task completion and response times are already visible in the system where the work is actually being tracked, the monthly rollup becomes reading a summary rather than manually compiling one from scratch.
The rollup happens on a predictable schedule, not squeezed in whenever there's time near the end of the month. Setting a specific day, the first Monday of the month, for instance, keeps it from becoming a last-minute scramble.
Trends get noted, not just point-in-time numbers. A single month's response time number is less useful than seeing it alongside the prior few months, since trends reveal whether something's actually improving, staying flat, or quietly getting worse.
The report actually gets used for something. A rollup that gets compiled and then filed away without prompting any actual conversation or decision isn't worth the effort it took to produce. The point of the numbers is to inform a decision about staffing, process, or priorities, not just to exist.
Where This Actually Breaks
The common failure isn't a lack of interest in understanding how the practice is running. It's that the data needed lives scattered across separate systems with no natural aggregation point, so producing a monthly summary requires manual reconstruction every single time, which is exactly the kind of recurring, tedious task that's easy to deprioritize or rush.
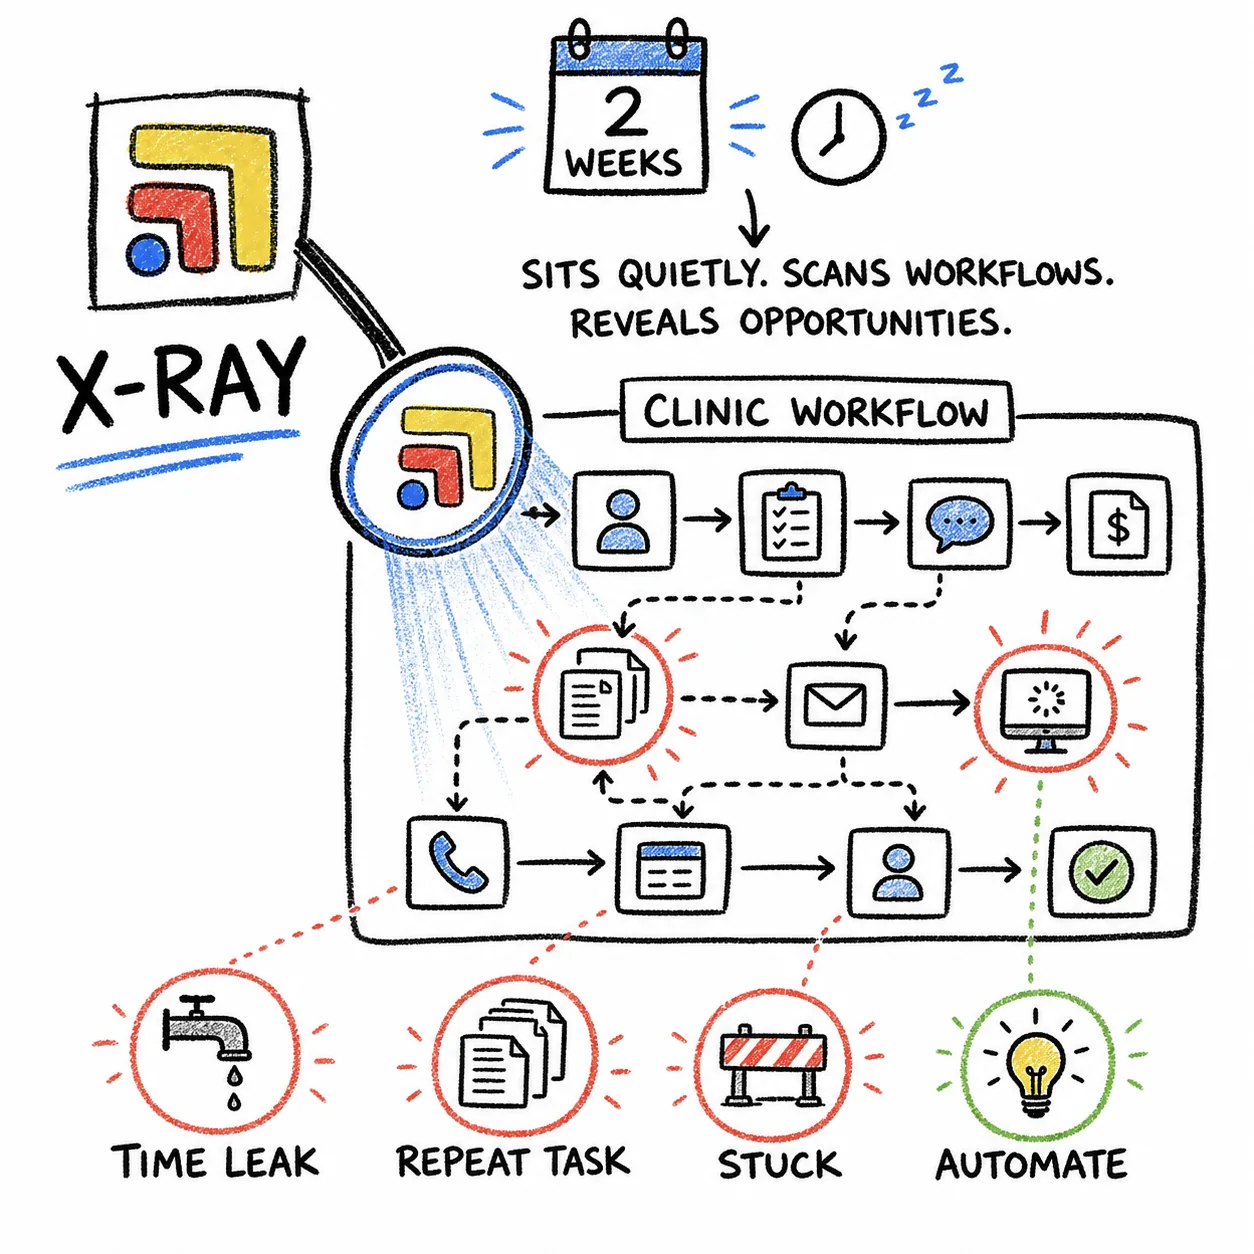
This is where Tabflows fits into monthly reporting. Because task activity, completion, and response times are already tracked as work happens, the monthly rollup is close to a built-in summary rather than a separate reconstruction project, freeing up the time that would otherwise go into manually compiling numbers from several disconnected systems.
The Standard Worth Setting
Pick a consistent set of metrics, capture the underlying data as work happens rather than after the fact, and review it on a predictable schedule. That standard turns monthly reporting from a dreaded scramble into a quick, useful check-in on how the practice is actually running.
FAQs
What operational metrics should a small clinic track monthly?
Common ones include task completion rates, average response time on messages and follow-ups, no-show rates, and workload distribution across staff. The right set depends on what the practice actually wants visibility into, but the key is picking a consistent set and tracking it the same way every month.
Why is monthly reporting often a scramble?
Because the underlying data lives scattered across separate systems, the EHR, the messaging platform, a scheduling tool, and pulling it together requires manually checking each one and compiling the numbers by hand, usually right before the report is due rather than throughout the month.
How can a practice make monthly reporting less painful?
By tracking the underlying activity in a system that already captures it as work happens, rather than as a separate reporting exercise, so the monthly rollup is closer to reading a summary than reconstructing one from scratch.
Who should own monthly ops reporting in a small practice?
A practice manager or owner typically compiles the rollup, but the underlying data collection works best when it's built into everyone's daily workflow rather than something added on top specifically for reporting purposes.